
Costa Rica starts 2026 with the best first quarter of international arrivals in its history
- Víctor Umaña

- Apr 23
- 4 min read
Signals that require attention persist
Costa Rica: International Arrivals and Tourism Revenues
Technical Note 06-2026 · January–March 2026 · Series 2019–2025
Published: April 2026 | Víctor Umaña, Executive Director CET

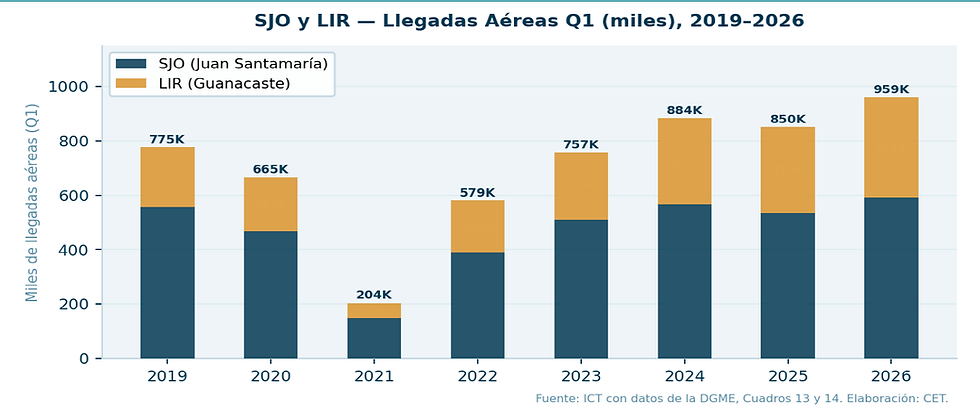
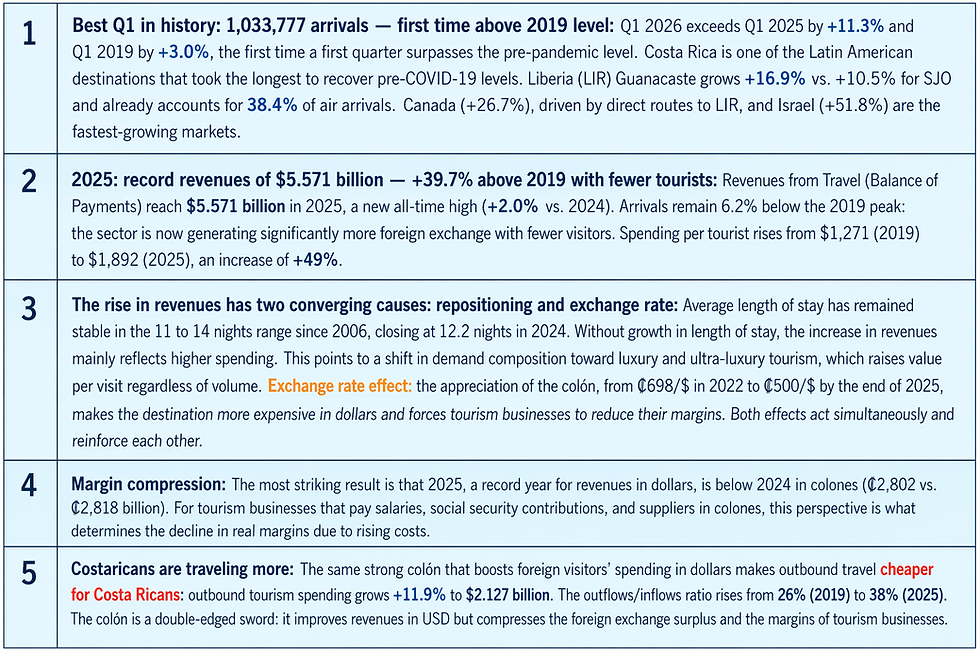
Costa Rica began 2026 with a historic result in international arrivals. During the first quarter, the country received 1,033,777 visitors, representing a year-on-year growth of 11.3% and, notably, the first time a first quarter surpasses the pre-pandemic level of 2019. This is a positive signal for tourism activity and confirms renewed momentum in visitor inflows to the country.

March performance was particularly strong. In that month alone, 379,818 international arrivals were recorded, an increase of 12.9% compared to March 2025. For the quarter as a whole, air travel accounted for most of the growth, with Liberia once again outperforming the national average. The Daniel Oduber Airport in Guanacaste reached 368,413 arrivals in the quarter, growing by 16.9% and consolidating its increasing role in the country’s tourism connectivity.
By source markets, North America maintained a clear lead, accounting for more than seven out of every ten arrivals during the quarter. Canada stood out among high-volume markets with a 26.7% increase, driven by the expansion of direct routes to Guanacaste. Europe also showed encouraging signals, with notable growth from Spain and Israel. In contrast, Central America was the only region to post a decline, mainly due to reduced land-based flows.

However, the broader interpretation should not focus solely on the increase in visitor numbers. The technical note also analyzes tourism revenues through the end of 2025 and highlights a particularly relevant phenomenon: Costa Rica reached a historic record of $5.571 billion in international travel revenues, a 2.0% increase compared to 2024 and 39.7% above 2019, despite total arrivals still remaining below pre-pandemic levels. In other words, the country is generating more foreign exchange with fewer visitors.

This decoupling between arrivals and revenues is arguably the most important finding of the analysis. According to the note’s hypothesis, this behavior reflects two simultaneous forces. First, a potential repositioning toward higher-value segments, with demand shifting toward higher-spending visitors. Second, the appreciation of the Costa Rican colón, which makes the destination more expensive in dollar terms and mechanically increases average spending when measured in USD.

The data on spending per tourist reinforces this interpretation. In 2025, it was estimated at $1,892 per visitor, a 49% increase compared to 2019. However, this improvement in dollar terms does not necessarily translate into a better reality for businesses that operate and incur costs in colones. In fact, when tourism revenues are analyzed in local currency, the picture changes: although 2025 was a record year in USD, in nominal colones it came in slightly below 2024. That is the uncomfortable detail. Revenues are higher in dollars, yes—but not necessarily more profitable in real terms.
Average length of stay does not explain the increase in revenues either. According to the series cited in the note, the duration of visits has remained stable for years, closing at 12.2 nights in 2024, very close to pre-pandemic levels. This means that higher revenues are not driven by longer stays, but by higher spending within a similar timeframe.
Another structural pressure adds to this dynamic. The same strong colón that makes Costa Rica more expensive for foreign visitors also makes outbound travel more affordable for Costa Ricans. As a result, outbound tourism spending continues to grow, reducing the net foreign exchange surplus generated by tourism. In 2025, that surplus reached $3.444 billion—still high, but 3.3% lower than in 2024. The ratio of outbound to inbound tourism spending has also increased significantly in recent years.

In summary, Costa Rica shows a very strong start to 2026 in terms of international arrivals, confirming its continued appeal as a destination. At the same time, the data suggest that strong performance in visitor numbers and dollar revenues should not be interpreted simplistically. Exchange rate dynamics, margin pressures, and rising outbound tourism all call for a more nuanced reading of the current situation.
From the CET’s perspective, this technical note aims precisely at that: to acknowledge the positive data, but with a clear-eyed view. Because in tourism, as in life, not every record necessarily translates into relief.


Comments